In digital marketing, accurately quantifying the impact of advertising on sales or other key performance indicators can be challenge. One statistical method that can help you estimate this impact is regression analysis. Regression analysis can help marketers isolate the specific effects of advertising spend from the myriad other variables that influence business outcomes.
Regression analysis examines the relationship between a dependent variable (like sales or leads) and one or more independent variables (such as advertising spend, seasonality, and market trends). This approach allows marketers to understand how inputs such advertising expenditure impact KPIs while accounting for other influencing factors. This analytical method is particularly crucial in environments where multiple factors simultaneously affect business performance, making it difficult to pinpoint the influence of advertising alone.
Imagine launching a nationwide advertising campaign and observing an increase in sales. It’s easy to assume that the campaign was the sole cause of this improvement. However, regression analysis allows us to estimate the degree to which the sales increase was due to the advertising compared to other factors like market changes or competitor actions.
Analyzing the Data
Start by gathering data. You can collect weekly or monthly data containing sales in one column and advertising spend in another. Using tools like Excel or Google Sheets, you could perform a regression analysis with sales as the dependent variable and advertising spend as the independent variable. The analysis will provide you with various indicators, but there are two that are particularly important for understanding the relationship.
- R-squared: This statistic reveals the extent to which changes in your advertising budget explain variations in sales. For example, an R-squared value of 0.50 indicates that 50% of the variability in your sales can be attributed to changes in your advertising spend.
- Coefficient: This value tells you the expected change in sales for each additional dollar spent on advertising. A coefficient of 2.5, for example, suggests that every additional $100 spent on advertising could increase sales by $250.
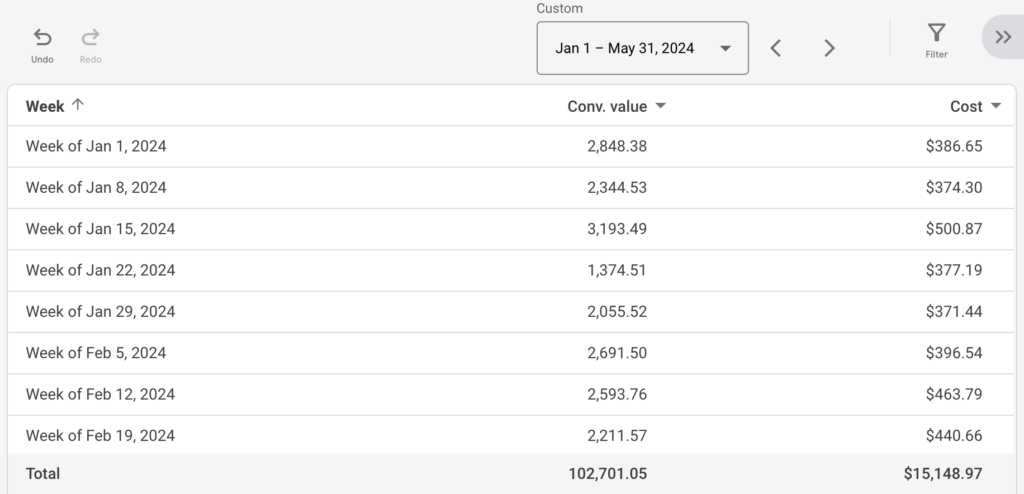
Here’s an example of how we can apply this to understand the impact of our Google ad spend on conversion value. The image below shows a snapshot of data taken from Jan 1 – May 31, 2024.
The following output was produced using the XLMiner Analysis ToolPack for Google Sheets to perform regression analysis.
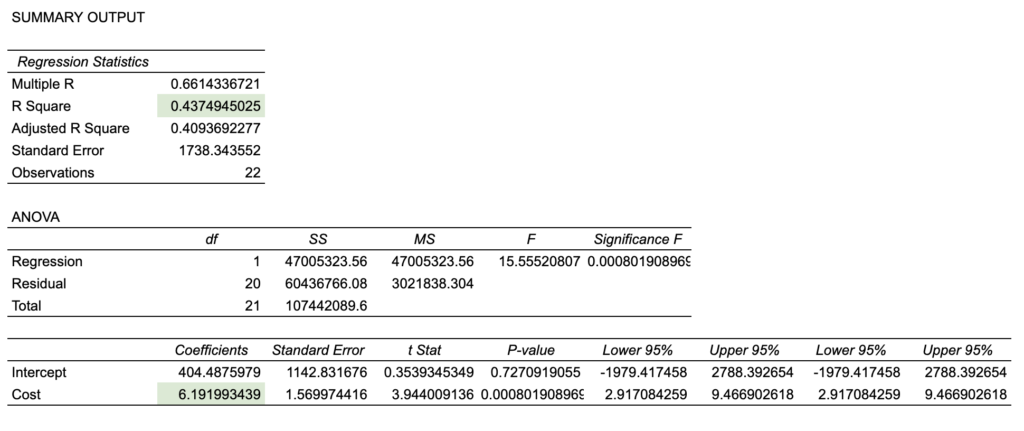
The R Square tells us that 43.7% of the variation in conversion value is explained by the advertising costs i.e. over half of the variability in conversion value is determined by other factors outside of advertising spend. The Coefficient tells us that for every dollar spent in advertising we can expect an increase in conversion value of 6.19. This is just a simple analysis but it provides an insight into using the power of statistics to understand the relationships between your advertising decisions and business outcomes.
The Takeaway
Regression analysis is more than just a mathematical exercise. By understanding and applying this technique, you can enhance your strategic planning, optimise your advertising spend and ultimately drive better business outcomes. In digital marketing it’s often tempting to view every outcome through the lens of the changes we make. Regression analysis can break us out of this bias and allow us to more precisely assess the specific impact of our actions.